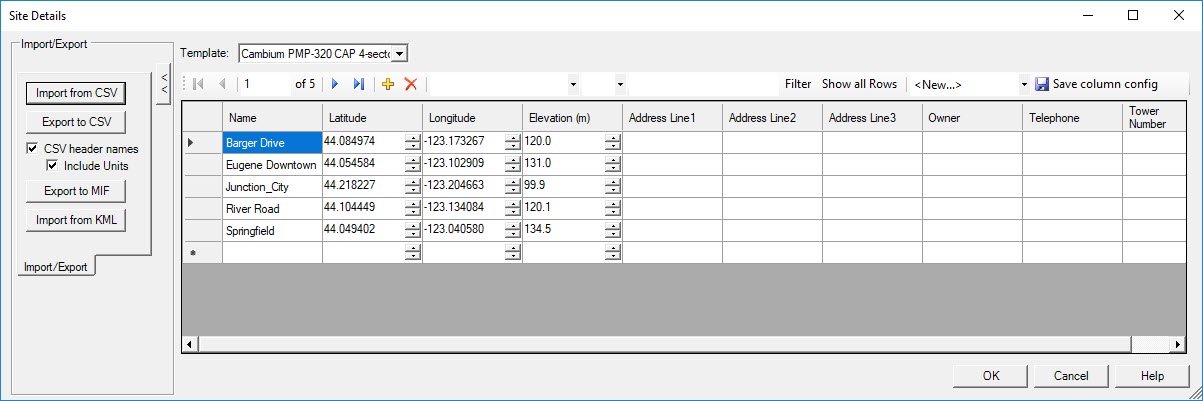
This feature allows you to edit the sites, sectors, links and CPE’s in tabular format. It is accessed through the RF Systems>Spreadsheet Editors menu options. For example, to edit the site data, selecting RF Systems>Spreadsheet Editors>Site Data brings up the following Site Details dialog box:
This dialog box shows the data for each site (location where transmitters are placed) in an easy, intuitive form for editing. New sites can be added and existing sites can be deleted using the spreadsheet editor. On the left side of the dialog box are buttons that allow the user to import “.csv” (Excel comma-delimited) site files into EDX software as well as to export the transmitter site data to a “.csv” format file.
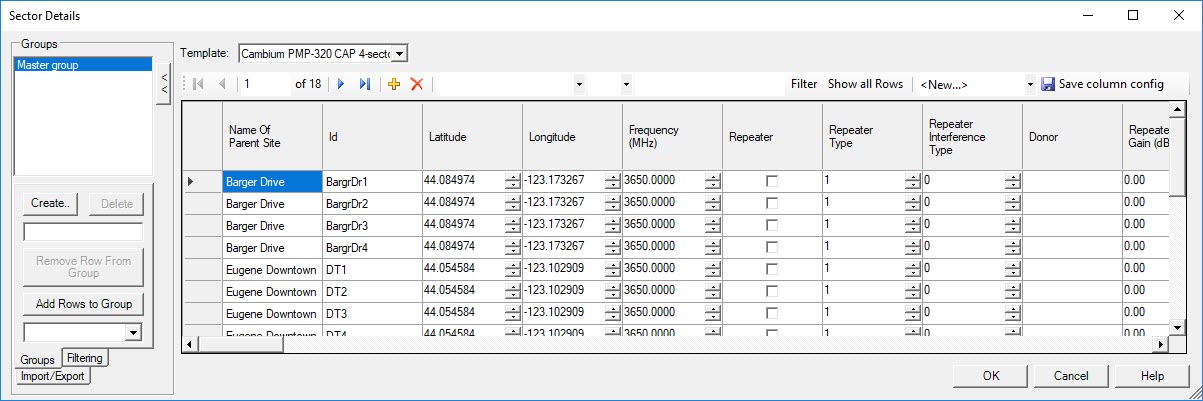
Selecting the Sectors Data spreadsheet editor brings up the following Sector Details dialog box:
Basic Spreadsheet Functionality
This dialog box shows the data for each sector/transmitter in an easy, intuitive form for editing. New sectors can be added and existing sectors can be deleted using the spreadsheet editor. On the left side of the dialog box are three functions that can be selected using the tabs at the bottom left. These include a Groups editing function that allows groups to be created, deleted and modified, a data Filtering function as well as a sector data Import/Export from/to “.csv” format files.
The Spreadsheet Editors option allows sector channel assignments, CPE and Link parameter data to be edited using the same functions and features as the Sectors Data spreadsheet editor.
Basic Spreadsheet Functionality
The spreadsheet area displays the data for your RF System in a simple row format. You can move through the cells in a particular row using the tab key, allowing for quick and simple data entry using just the keyboard. The spreadsheet follows some familiar concepts such as copy/paste, delete and add.
Copy/Paste Data
When copying, you can copy a single data cell, a selection of cells, or entire rows. To copy a single cell, simply select the cell and use the context menu or CTRL-C shortcut. To copy a selection of cells, click the first cell and drag the mouse to the last cell. Then use the context menu or CTRL-C shortcut. To copy an entire row or rows, just click on the left side.
You can paste your selected data into the spreadsheet or Microsoft Excel. Likewise, you can copy from Microsoft Excel and paste the data into the Spreadsheet. NOTE: When you paste, it is extremely important your columns match up. The copied data should be based on the same columns as where you want to paste the data.
Column Fill
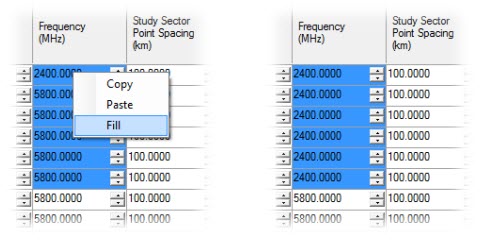
The column Fill command allows you to fill a column (or columns) with a particular value. Select a top cell and with the left mouse button still held down, drag down the column until your desired cells are selected. You can also use the SHIFT+CLICK command to quickly select cells. Right-click on a selected cell and choose the Fill command. All of the cells will now be automatically filled in with the value in the topmost selected cell.
In the above example, the Frequency for each row is currently set to 5800 MHz but the user would like some cell values to be changed to 2400 MHz. The user has set the first row to 2400 and then selected which cells they want filled. After the Fill command is complete, the selected cells have all been changed to 2400, and the unselected rows remain at 5800.
The above example shows the Fill command for a single column, but fill can also be performed across multiple columns at once.
Column contextual menu
Right-clicking on a column header, displays a contextual menu with options to select, hide/show or freeze the various columns of interest.
Select Column
Right clicking on a column header allows you to choose the Select option which highlights (selects) all the data entries in that column.
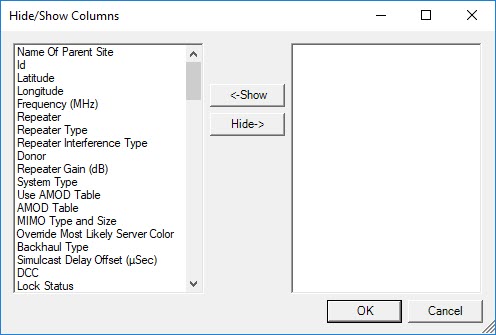
Hide/Show Columns
The Hide/Show Columns dialog allows you to move columns between the displayed columns (on the left) and the hidden list (on the right) using the Hide-> and <-Show buttons. You can move multiple columns at a time by selecting all the names and clicking the appropriate button.
Freeze
Right clicking on a column header and selecting Freeze allows you to freeze the column. Freezing a column makes the column (and all columns to the left) remain in place while you scroll.
Save Column Config
The Save column config button allows you to name and save your current column settings, which means you can save different column settings for a particular task or perhaps based on the current user's role. The currently frozen column and the column visibility are saved.
To save the settings, follow these steps:
Define your columns using the Freeze and Hide/Show options.
Above the spreadsheet is a drop down-list with the text '<New...>'. Select the '<New...>' option from the list.
In the Template Name dialog box, enter a name for the your current column settings template.
Click the ‘OK' button to close the dialog box and then click the ‘Save Column Config’ button and your settings are now saved in the newly named template.
Use the drop-down list to create new column settings and to select already defined settings.
Remember to click on 'Save column config' anytime you make a column change and want it saved to the current name.
Adding a New Row
To add a new line (row) of information, click in the last empty row at the bottom of the column. An asterisk (*) in the row header designates this row. For those systems relying on Templates (Sites, CPEs and Links), the row will automatically pre-fill with the currently selected template’s data. The template selection is the dropdown just above the grid navigation buttons.
Quick Add and Delete
In the toolbar strip above the column headers are two buttons: one for adding rows [icon] and one for deleting rows [icon] .
When adding a row using [icon], the new row will be pre-filled with the values from the current row. Note how this is different behavior compared to clicking in the bottom, blank row to create a new row.
When deleting a row using [icon], the current row will be removed from ALL groups, including the Master Group. You can also select multiple rows and use [icon] to remove all of the selected rows at once.
A little later in this section, we will describe how to remove a row from only a specific group.
Row Filtering
The filter toolstrip allows for quick filtering of the current rows. The example image shown below will filter rows to display only sectors with a frequency of 2400 MHz.
First, enter your filter criteria. Once setup, click the Filter button. This will display only the rows matching the filter criteria. You can continue to filter the rows using this method. Click the Show all Rows button to remove any filters and displays all the rows.
Using row filtering does not actually make any changes to your groups but instead is a way to temporarily view specific rows.
Group Viewing/Editing
You can filter your list based on using the Groups tab (not available for Site or Sector Channels Data). Selecting Master group will display everything. Selecting one of your defined group names will display only the data for the selected group. This tab allows you to create new groups, delete existing groups and add or remove rows within groups.
To create a new group, type your new group name into the edit box. Then click the Create button. This will give you a new, blank group. The Group Filtering section below explains how to add items to your group.
To delete a group, select the group from the list and click the Delete button. This will remove the group.
Earlier we described how to delete or add a row. Deleting a row removed the entire item from the current project. That is, it was removed from every group, including the Master group. The Groups tab allows you to remove one or more rows from just a specific group or add one or more rows to a specific group. To remove row(s), when you have selected a group (other than Master group) from the Groups window, highlight the row (or rows) and click the Remove Row From Group button. This will remove the row(s) from only the selected group. Any other group containing these items will not be changed. You can also add one or more rows to a specific group (the target) from another specific group (the source). To add rows, first select the “target” group (other than Master group) from the drop-down list below the Add Rows to Group button. Next highlight the desired “source” group from the selections in the Groups window and the group rows will display in the spreadsheet editor. Finally, click and highlight the “source” group rows that need to be added to the “target” group and then click the Add Rows to Group button. To view the newly added rows in the “target” group, highlight that group name in the Groups window.
Group Filtering
The Filtering tab is where you can add data to your groups. There are two buttons which open up a Group Filter dialog box, allowing you to update your groups. When selecting the Replace button, the dialog box will completely replace the current items in your group with a new list of items. When selecting the Add button, the dialog box will add items to the group’s current list of items.
Once in the Group Filter dialog, you can create new filter conditions using the insert filter conditions Add button. You can save your filters and load them again. Once you have the filter conditions defined, click Submit Query to find rows meeting the conditions. These rows display in the bottom grid and represent the rows to add to the selected group.
The Group Filter dialog example above shows a very simple query where “Name Of Parent Site” is between (and including) EE and LL. The Select From Existing Group drop-down list allows you to limit the rows for querying. For example, if you have a “Northwest” Sector group, you may want to start based on the rows in this group. Then run a filter on this set of items to create a new sub group, “Northwest Repeaters”, containing only those sectors which are repeaters.
Once you have the results listed, click the OK button to add those rows or replace the current rows in the selected group.
Importing/Exporting CSV Files
Perhaps you have a customer who has given you a “.csv” file, or you want to give someone a “.csv” file. The Import/Export tab in the Spreadsheet Editors allow you the option to import and export “.csv” file formats. The “.MIF” and “.KML” file format options are available in some of the dialogs.
When importing from a file, any data field not listed in the file will be automatically filled with the selected template data showing in the template drop down menu. For example, you can import CPEs from a “.csv” file containing the name, latitude and longitude. All of the other fields will be filled with the selected CPE template data.
Import from CSV/Export to CSV
Clicking the Export to CSV button will export the currently visible columns to a “.csv” file. The CSV header names checkbox is used to define whether or not the “.csv” file should list the column headers in the file.
Clicking the Import from CSV button will import the “.csv” file data into the spreadsheet. The CSV header names checkbox is used to define whether or not the “.csv” file contains a header row.
If the “.csv” file does contain the header names, then the import routine will automatically map the columns from the “.csv” file to their appropriate column (that is, the “.csv” data can be listed in any particular order). NOTE: The “.csv” column headers must exactly match the EDX column headers. If the header names do not match, the data will not be imported.
If the “.csv” does not contain header names, then the “.csv” must list each row data exactly as currently displayed in the Spreadsheet Editor. NOTE: When using a “.csv” file without column header names, it is very important for the file’s column ordering to match exactly with the spreadsheet’s columns or the data will not be imported properly.
It is important to keep in mind your displayed coordinate units. When importing, the Spreadsheet Editor must use the same displayed coordinate system as the “.csv” file when importing. If not, go to Map>Units and set the coordinates to match what you are importing.
Export to MIF
Some of the Spreadsheet Editors allow you to export their point data in “.MIF” file format. After selecting a filename to save, you are prompted with a dialog to select a specific symbol or to use a point.
Import from KML
The Spreadsheet Editor for Sites Data allows you to import site locations from a “.KML” file format. The sites will use the currently selected Template to define what kind of site is created.


