...
EDX software is built like most Windows software. The main application window contains all of the components of the tool. When you first open EDX software, the application window is gray, and most of the menu bar and button bar are grayed out. This indicates the Program is running, but no project has been opened and loaded into the software. Once you’ve opened a project, the menu bar and button bars become active, as well as the main display shows the last saved map state of your project.
The Menu Bar
...
The menu bar is used to set up and drill down into details of the program, such as setting up studies, propagation models and the like. Each menu item has its article. Check out the related articles below to learn more.
The Button Bar
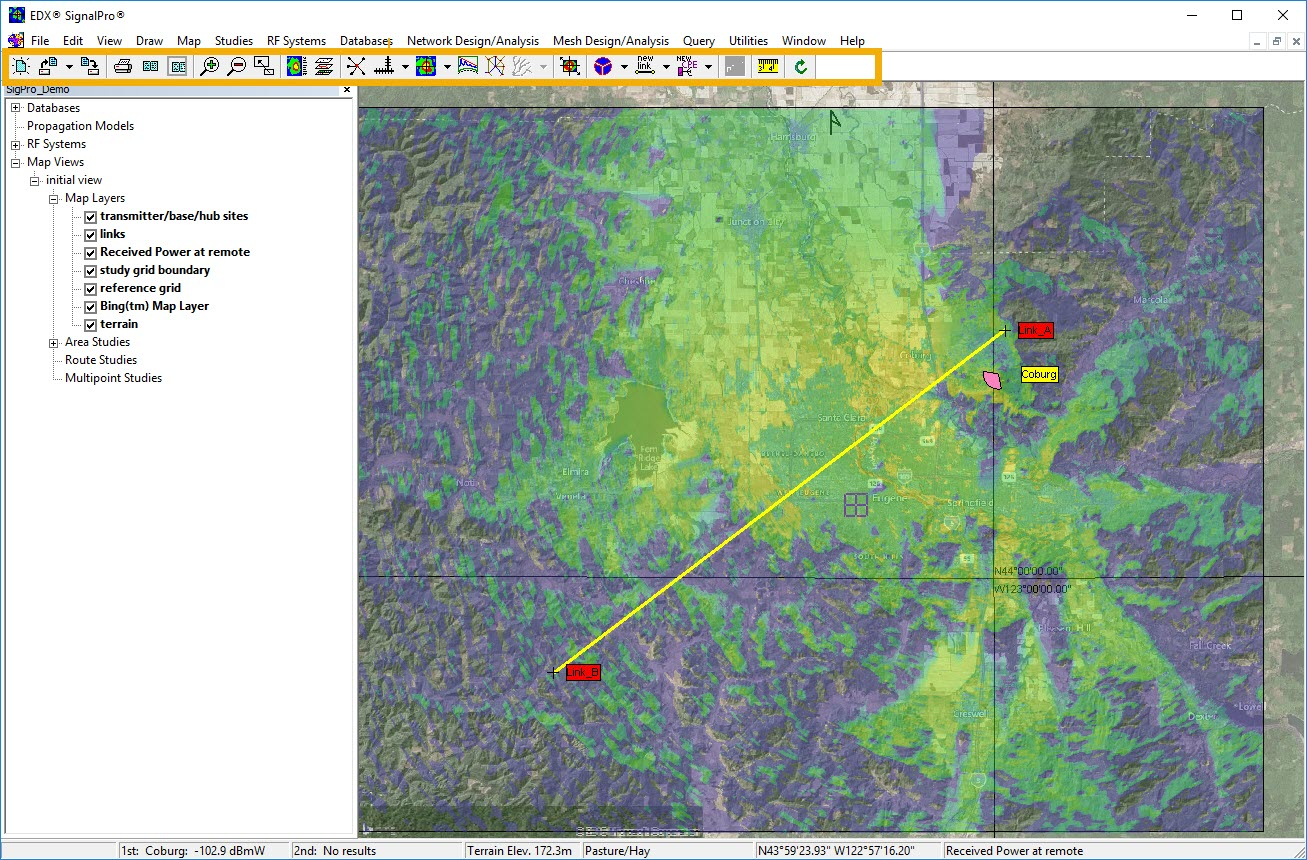
The button bar contains tools that cause an action to happen, or trigger a shortcut. If you hover your cursor over a button, you will get a short description of what that button does.
The Project Pane
The Project Pane (See the Show Project Pane article for more information) is an alternative navigation method for the program. For example, if you wanted to modify the frequency of a transmitter you could go to the RF Systems menu, choose Transmitter/Base/Hub/Router Sites, edit the Master Group, select your transmitter, Edit your transmitter and change the frequency. This is a large number of steps just to change a frequency. Instead, in the Project Pane you could expand the RF Systems entry, expand the Transmitter/Base/Hub/Router Sites entry, find your site in the list and double-click on it, then change the frequency, using quite a few less steps than the menus.
...
The default window/map view setting is for one main map view fully expanded to take up all available space in the main application window. If you go to the Window menu, you can tile all active main map views, seeing more than one at a time. A caution: since the views are independent, you can set up a large number of study and map layers that the program needs to keep track of. Over time, if they are very large, you may notice the program slowing down when returning mouse control to you. If you find that you click OK to exit a dialog box and it takes longer and longer, you might consider reducing the number of views, or moving some views to a different project.
The Status Bar
...
The Status Bar displays specific numerical information not available in the graphic results. For example, a received power at remote study shows signal levels by coloring the study grid. Setting the status bar to show the results of a study allow you to see the actual signal level at the cursor point for that study.
...
If you right-click on the 7th position you will get a sub-menu similar to what you saw earlier by right-clicking on the Area Studies selection in the project pane, with the only difference being in the 7th position, there is an additional option with the name(s) of the specific area studies listed under Area Studies. Hovering the mouse over an area study name brings up another sub-menu that is the same as right-clicking on an area study in the project pane.
The Map Marker
The Map Marker appears on the main map as a small square with cross-hairs:
...